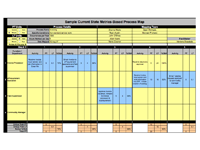

Mike Osterling and my new book, Metrics-Based Process Mapping, appears to be striking a cord with many. Yesterday I held a webinar with the highest attendance ever. People from 12 countries gathered to learn about how to use Metrics-Based Process Mapping (MBPM) to improve processes and create standardized work in cross-functional environments.
Click here to watch the recording.
You might want to listen to the end to hear how I answered a question that ended with “Is this wrong?” and my answer was, “Yes.” I rarely say “right” or “wrong,” but in this case, the person was describing a recipe for disaster—where processes are improved and then ignored. I didn’t go into Key Performance Indicators in my webinar due to time constraints, but the gentleman’s question points out that organizations have a long way to go in understanding what it takes to manage processes properly and operate effectively.
Wanna buy the book (which includes a macro-heavy Excel-based process documentation tool that auto-calculates your results)? Click the cover below.
The rationale and process for calculating free capacity is also included in all of my other books, both solo and with co-author Mike Osterling: Value Stream Mapping, The Outstanding Organization, and The Kaizen Event Planner.
Hi Alfred – Glad you’re using MBPM. Yes, you can express freed capacity in time, FTEs, or labor dollars to illustrate improvement. (Just be sure you never, ever lay off staff as a result of making improvement!) The first correlation you need to make is the PT associated with the rework. Then multiply the reduction you achieve in PT hours due to improved %C&A (current state minus future state) by the number of times that process is performed per year, and then divide that number by the number of available work hours per year per employee.
To calculate the available work hours per year, start with the number of paid hours per employee per year, which is typically 2,080 hours per year, and subtract the number of hours of paid time off per year (holidays, vacation time, sick time, etc.). You may also wish to subtract the hours from regularly scheduled meetings, training sessions, etc. I typically only deduct paid time off. The available work hours per employee per year for most organizations ranges from 1,750-1,975 hours.
Does this help?
Hi Karen – Thanks for prompt answer. Could you please provide some example of %C&A correlation with PT from your practice? During the mapping session I find people struggling to translate %C&A improvement into PT reduction figure. In some cases they refer to process demand reduction instead of PT. What is your best practice/advice for facilitators to help struggling participants make those quality improvement correlation to PT or demand reduction?
by Alfred Sasko
Hi Karen, I have used Matrix Based – Process Mapping during many Work Outs in Shared Services Organization and facing often management paradigm change when they looked to huge amount of rework in the processes expressed by 5-10% rolled %C&A. Many Managers and Executives are asking how to translate quality improvement to freed capacity (FTE’s). Is there any calculation method expressing relationship between FTE and %C&A apart of FTE and PT?