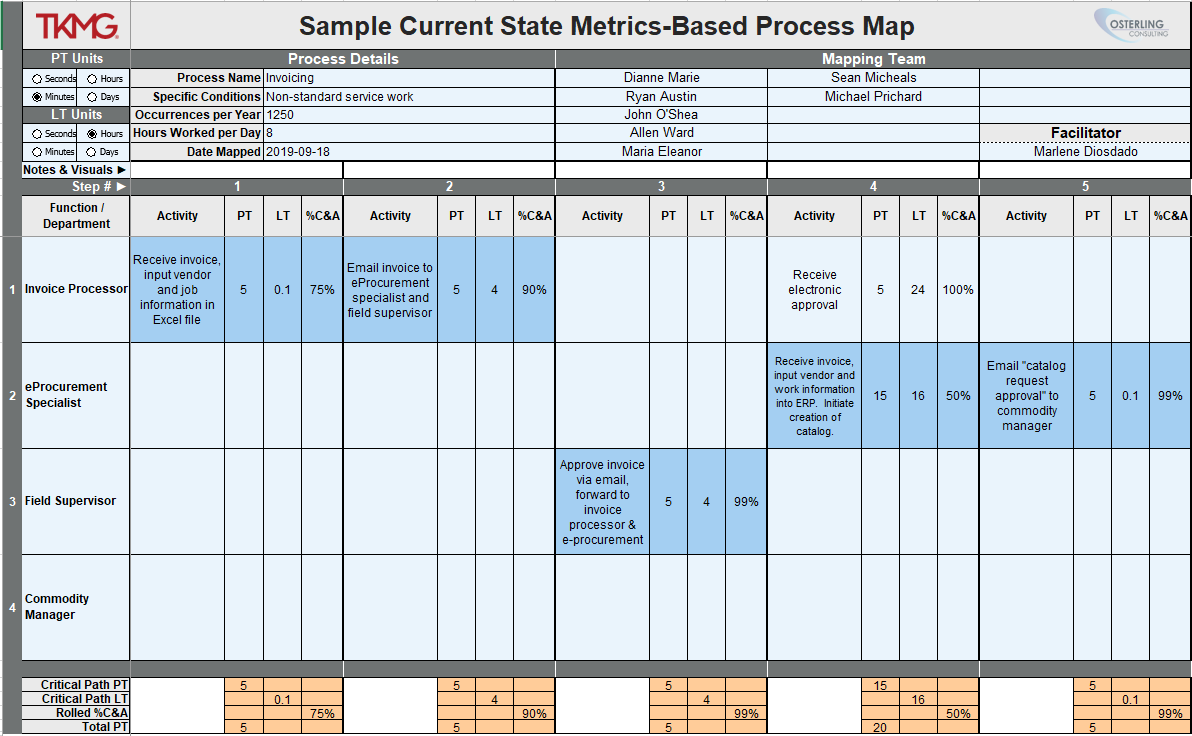

Metrics-Based Process Mapping (MBPM), developed by Mike Osterling and Karen Martin, is a tactical-level, visual mapping approach that enables improvement teams to make effective, data-based decisions regarding waste elimination and measure ongoing process performance. The mapping technique, typically used to drill down from a value stream map, integrates the functional orientation of traditional swim lane process maps with time and quality metrics that are essential for designing improved processes.
The Excel-based tool provides a user-friendly way to electronically archive manually created maps in team settings for easier storage and distribution across an organization. The electronic maps serve as standard work documentation for the improved process, enabling training and process monitoring activities.
Questions? Email us at info@tkmg.com.
Metrics-Based Process Mapping takes readers to the next level in understanding processes and process improvement. The Excel-based tool features:
System Requirements: The tool is intended for use on PCs only — it will NOT function on Macintosh computers. It also requires a full version of Excel. It will not function on stripped down versions of Excel.